Trading strategy testing in Pine Script
Pine Script TradingView AnalysisTask
I was given the task of developing a comprehensive trading strategy using Pine Script, a programming language designed for creating custom indicators and strategies on the TradingView platform. The challenge involved identifying key market conditions and parameters to effectively execute trades, while also ensuring that the strategy could adapt to varying market trends and volatility.
Solution
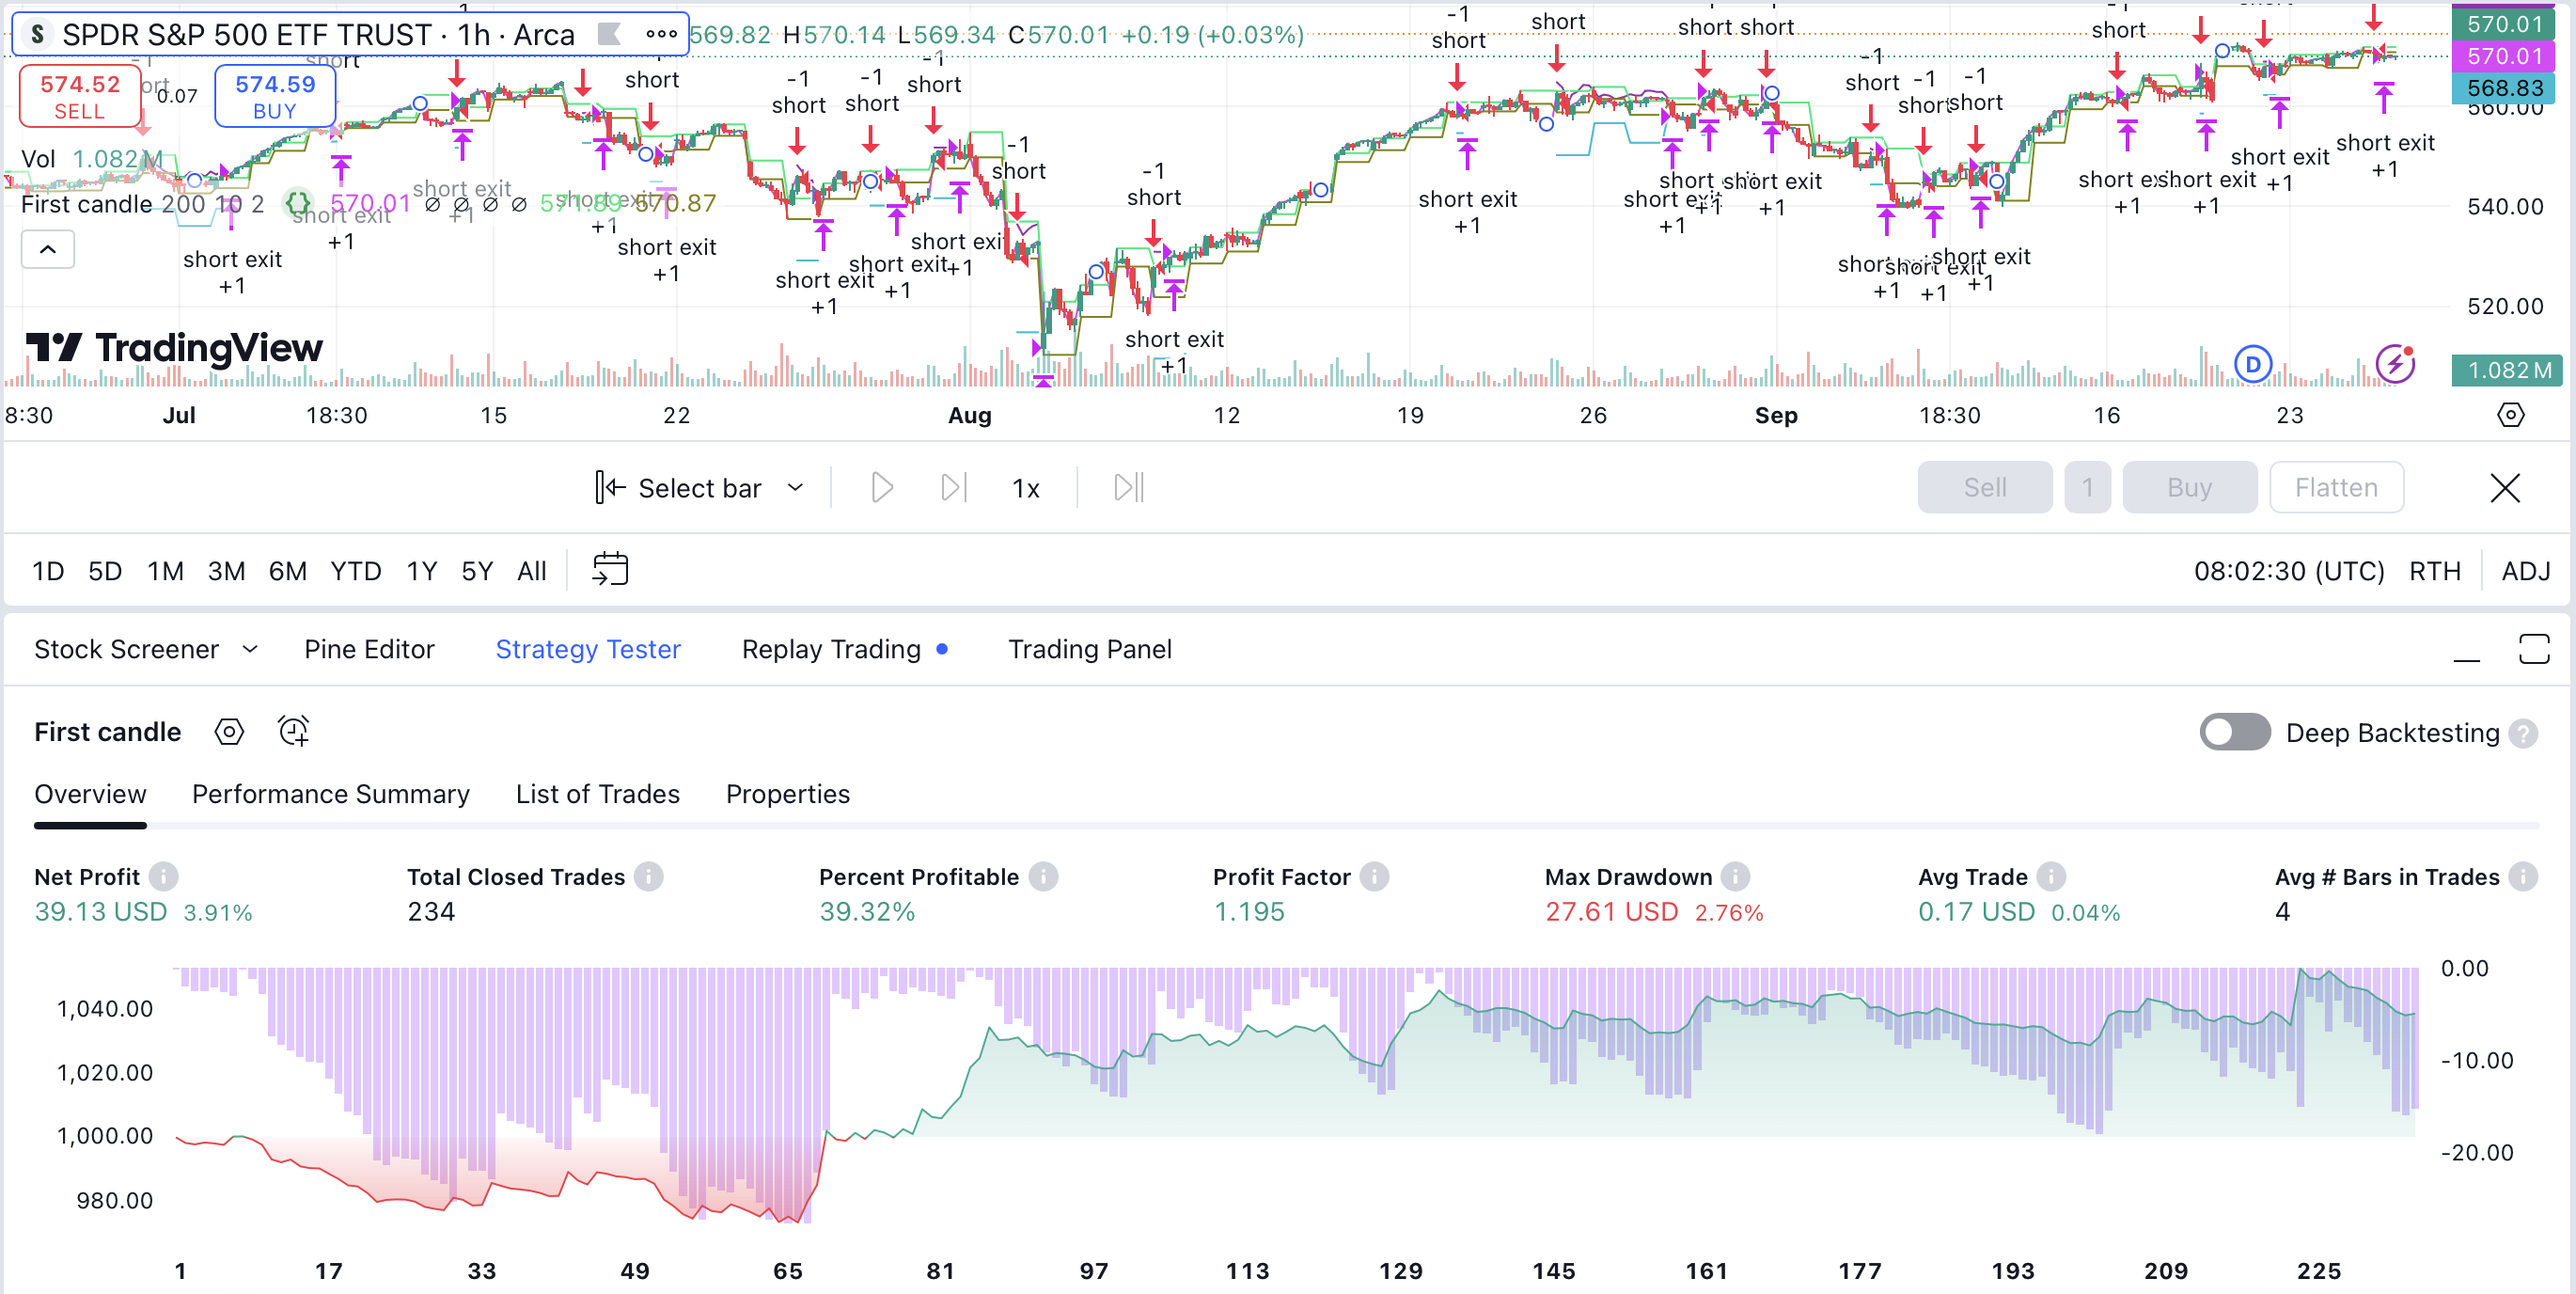
I addressed this task by creating a robust trading strategy that incorporates technical indicators such as moving averages and start of day position to signal entry and exit points. Using the TradingView platform, I backtested the solutions I came up with in order to evaluate the strategy's performance across historical data. This approach not only provided insights into potential profitability but also allowed for adjustments based on risk management principles, ultimately resulting in a flexible and effective trading strategy.
// This Pine Script™ code is subject to the terms of the Mozilla Public License 2.0 at https://mozilla.org/MPL/2.0/
// © janivkovic11111

//@version=5
strategy("First candle", overlay = true, initial_capital = 1000, default_qty_type = strategy.fixed)

// First candle of the day
is_new_day = time("D") != time("D")[1]
since_new_day = ta.barssince(is_new_day)
firstHigh = high[since_new_day]
firstLow = low[since_new_day]
firstDiff = firstHigh - firstLow
since_below_high = ta.barssince(close < firstHigh)
since_above_low = ta.barssince(close > firstLow)

// // EMA
ema_input1 = input.int(200, "EMA len")
ema = ta.ema(close, ema_input1)

// Strategy
bc = math.abs(close - open) > firstHigh and (time - time[since_below_high]) > 1000 * 60 * 40 and ema < close
sc = math.abs(close - open) < firstLow and (time - time[since_above_low]) > 1000 * 60 * 40 and ema > close

// Stop loss and target price
percentage_based = input.float(10.0, "% Stop multiplier", minval = 0.0, step = 0.1)
r_ratio = input.float(2.0, "Risk reward ratio", minval = 0.0, step = 0.1)
stop_loss_amount = firstDiff/2

bought = strategy.position_size[0] > strategy.position_size[1]
since_entry_long = ta.barssince(bought)
sold = strategy.position_size[0] < strategy.position_size[1]
since_entry_short = ta.barssince(sold)

price_stop_long = 0.0
price_stop_short = 1000000000.0
target_val_long = 0.0
target_val_short = 0.0
stop_val_long = 0.0
stop_val_short = 1000000000.0
since_stop_long = 0
since_stop_short = 0

if (strategy.position_size > 0)
    price_stop_long := close[since_entry_long] - stop_loss_amount[since_entry_long]
    target_val_long := firstHigh + r_ratio * firstDiff
    if (close - stop_loss_amount > stop_val_long)
        stop_val_long := close - stop_loss_amount
else
    price_stop_long := 0.0
    stop_val_long := 0.0

if (strategy.position_size < 0)
    price_stop_short := close[since_entry_short] + stop_loss_amount[since_entry_short]
    target_val_short := firstLow - r_ratio * firstDiff
    if (close + stop_loss_amount < stop_val_short)
        stop_val_short := close + stop_loss_amount
else
    price_stop_short := 1000000000.0
    stop_val_short := 1000000000.0

// Executing trades
if (bc and strategy.position_size <= 0 and (time - time[since_new_day]) < 1000 * 60 * 60 * 3)
    strategy.entry("long", strategy.long, limit = firstHigh)//, qty = 1000)
if (sc and strategy.position_size >= 0 and (time - time[since_new_day]) < 1000 * 60 * 60 * 3)
    strategy.entry("short", strategy.short, limit = firstLow)//, qty = 1000)


// Stop loss and target
if (strategy.position_size > 0)
    strategy.exit("long exit", from_entry = "long", limit = target_val_long, stop = math.max(price_stop_long, stop_val_long))
if (strategy.position_size < 0)
    strategy.exit("short exit", from_entry = "short", limit = target_val_short, stop = math.min(price_stop_short, stop_val_short))

// Plotting
plot(close, "Close", color = color.fuchsia)
plot(price_stop_long > 0.0 ? math.max(price_stop_long, stop_val_long) : na, "SL long", color = color.purple, style = plot.style_linebr)
plot(price_stop_long > 0.0 ? target_val_long : na, "Target long", color = color.aqua, style = plot.style_linebr)
plot(price_stop_short < 1000000000.0 ? math.min(price_stop_short, stop_val_short) : na, "SL short", color = color.purple, style = plot.style_linebr)
plot(price_stop_short < 1000000000.0 ? target_val_short : na, "Target short", color = color.aqua, style = plot.style_linebr)
plot(firstHigh, "First high", color = color.lime, style = plot.style_linebr)
plot(firstLow, "First low", color = color.olive, style = plot.style_linebr)
plot(ema, "EMA")